I am a student at in Uru Mānuka. In 2020 I was a year 8 and in 2021 I will be a year 9. This is a place where I will be able to share my learning with you. Please note....some work won't be edited - just my first drafts, so there may be some surface errors. I would love your feedback, comments, thoughts and ideas.
Showing posts with label cyclone. Show all posts
Friday, 20 March 2020
How to make a graph in google spreadsheet.
Labels:
👾👽,
acid rain,
cyclone,
hard plastic thingy,
OoT,
Playback hurumanu,
pys edu,
Room 10,
sci,
YAAA! papa
Pie Graphs
a pie chart is a chart that shows percentages and portions here is an example of peoples favourite animals. as you can see cats are the most popular, and goats are the second most popular, and dogs are the third
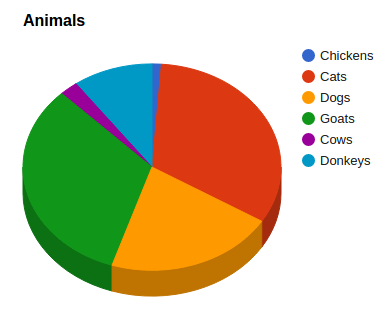
Labels:
👾👽,
2018,
5 Nights At Freddy's,
cyber smart,
cyclone,
frotnit,
Japan
Subscribe to:
Posts (Atom)