Friday, 20 March 2020
How to make a graph in google spreadsheet.
Pie Graphs
a pie chart is a chart that shows percentages and portions here is an example of peoples favourite animals. as you can see cats are the most popular, and goats are the second most popular, and dogs are the third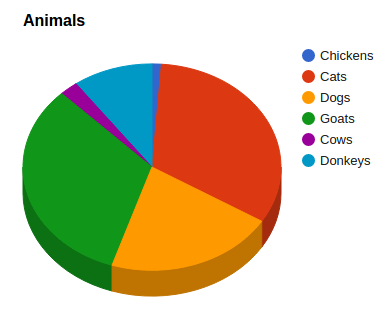
Thursday, 12 March 2020
Critical Questions
For hurumanu we had to answer questions and here the questions are:
Why are we reading these stories? We are reading these stories to improve our reading skills
How would these stories be different if they were set in a different time place or culture? The culture part would be alot different because mauri are a lot different to other cultures. If it was in a different place they wouldn't be able to make all the stuff they made in New Zealand. If it was in a different time ex. Now it would be boring because now we have all of these responsibilities like school or work.
Tuesday, 10 March 2020
Eat healthily
Subscribe to:
Posts (Atom)